Saturday, June 19, 2010

ACEGES software: Smoothing the Monte Carlo Oil Production data

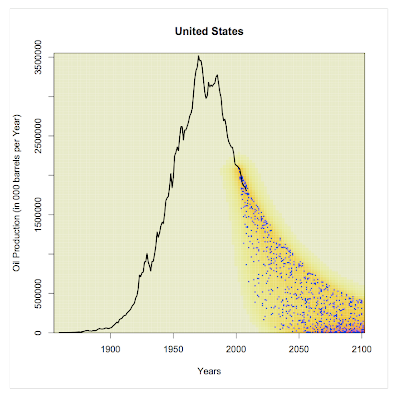
Following from my last posting, these are some figures (Ecuador & US out of the 93 countries modeled) of the simulated data, generated using the ACEGES software and analysed using the R statistics software.

Black line is the actual production, blue dots is a sample of the 3.2 million (simulated) records (see last figure - US) and the density is based on the whole 'population' of the 3.2 million records.


Friday, June 18, 2010

ACEGES software: Preliminary Results

I have recently completed the ACEGES 1.0 software. This is an agent-based model of conventional oil production for 93 countries.

Due to the uncertainties with the EUR data and the oil demand, I implemented a Monte Carlo simulation that uses distributional assumptions of EUR data and oil demand based upon the data released from the Energy Information Administration, International Energy Agency, CIA and the US Geological Survey.

Next month, I will finish the User Guide and I will post the software on the CIBS website: http://www.londonmet.ac.uk/lmbs/research/cibs/cibs-scenario-planning/cibs-scenario-planning_home.cfm . If you want to access it earlier, please email me at v.voudouris@lodonmet.ac.uk

THe figure below sow the results from the US & Kuwait . RED line is the actual production while the black dots are the simulated data (77 simulation runs of 99 steps).